Evaluation · 8 min read · Sep 16, 2026
A leaderboard is a diagnostic, not a verdict.
Every model launch produces a scoreboard and a wave of buying decisions made from it. The scoreboards are not fraudulent — they are measuring something real. They are just not measuring the thing that decides whether your system works, and the gap between the two is now large enough to have been put a number on.
The size of the gap
Prefactor's analysis of enterprise agentic systems puts the gap between lab benchmark scores and real-world deployment performance at 37%, with a 50x spread in cost between systems reaching comparable accuracy. That second number is the more alarming one, and it never appears on a leaderboard at all.
The gap does not open because models underperform their advertising. It opens because a benchmark measures accuracy on a curated dataset, usually single-turn, and production measures something else entirely: behaviour on your data, under your constraints, across multi-step pipelines where errors compound, with upstream drift and API timeouts and adversarial input.
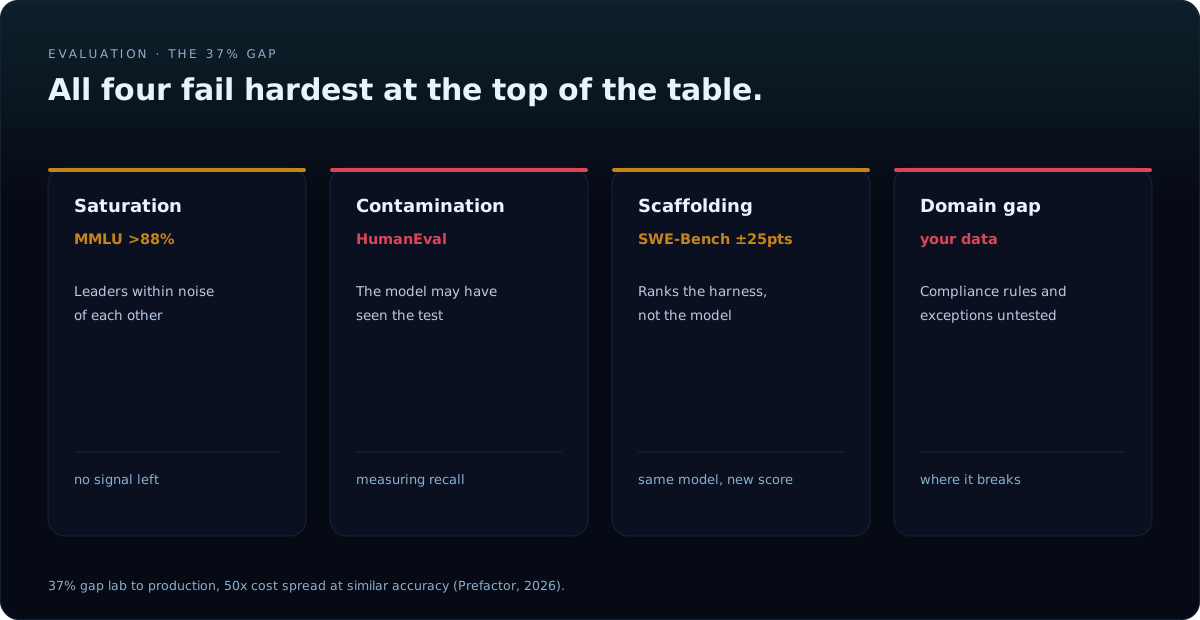
Saturation makes the top of the table meaningless
MMLU and MMLU-Pro are functionally saturated above 88% for frontier models, which means the differences between the leaders are no longer statistically meaningful — you are reading noise and treating it as ranking. Kili's survey of the 2026 benchmark landscape walks through this and the related failures.
Two more are worth knowing by name. HumanEval suffers training-data contamination, so a model may have seen the test. And SWE-Bench scores move by as much as 25 percentage points depending on the scaffolding around the model — meaning a large part of what is being ranked is the harness, not the model. Arena Elo, meanwhile, reflects general user preference, which can point the wrong way entirely in a specialised domain.
When benchmarks do predict
They are not useless. They predict production performance when three conditions hold together:
- The benchmark tests tasks like yours. A coding index says little about document extraction under a compliance format rule.
- The test set is clean of contamination. Otherwise you are measuring recall of the answer key.
- The benchmark has not saturated. If the leaders are within a point of each other and of the ceiling, there is no signal left to read.
All three fail routinely at the top of the table, which is exactly where buyers look. That is the whole problem in one sentence.
The dimensions no benchmark reports
| What decides production | Whether a leaderboard measures it |
|---|---|
| Cost per run on your traffic shape | No |
| Latency under your concurrency | No |
| Behaviour on your exceptions | No |
| Whether it signals its own uncertainty | No |
| Handoff success across a multi-step chain | No |
| Compliance with your output format rules | No |
A model that ranks first on general reasoning can still hallucinate confidently in a specialised domain, and one that tops a coding index can still violate an internal formatting rule on every single output. Neither failure is visible from the score.
What to do instead, concretely
The practitioners quoted across this literature converge on the same replacement, and it is smaller than people expect: build a custom evaluation of 100–200 examples drawn from your own history. That is enough to predict production behaviour, and it is a day of work rather than a quarter.
Then instrument the thing once it runs. Score the last 500 production runs on task accuracy, cost, and at least one risk dimension, and compare that distribution against what the pre-deployment benchmark predicted. The delta is your own version of the 37%, measured rather than borrowed. For multi-agent orchestration specifically, handoff success rate is reported as the single most predictive metric for production stability — which matches the failure mode we describe in when multi-agent helps and when it hurts.
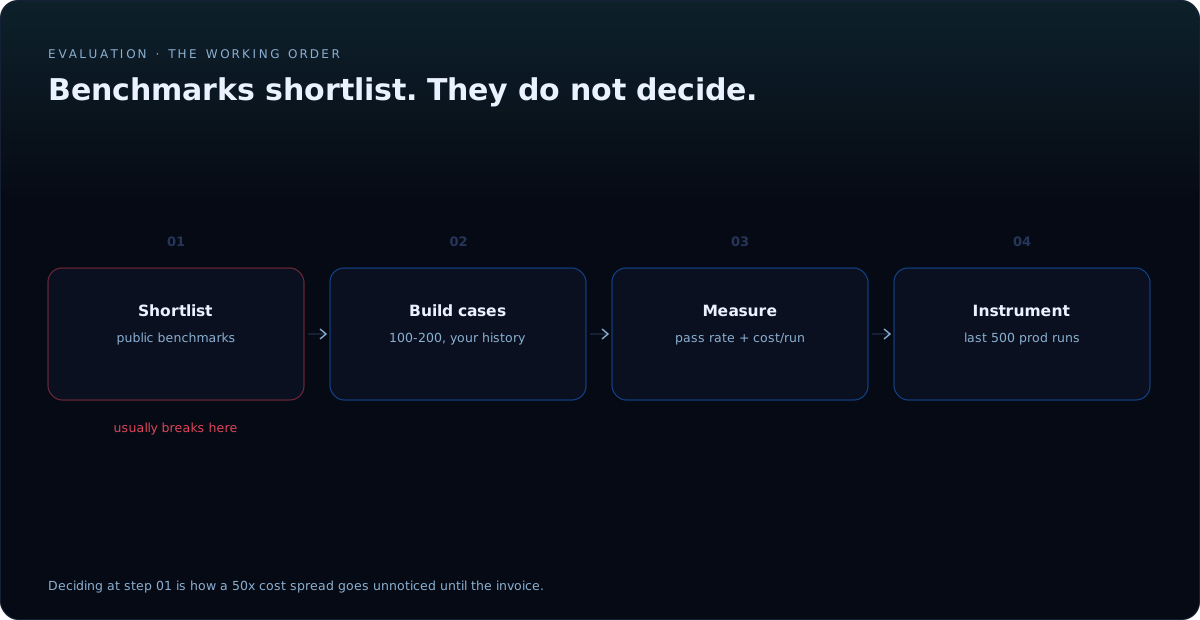
Benchmarks inform model selection. Domain evaluation determines production readiness. Treating the first as the second is how a 50x cost spread goes unnoticed.
The cost blind spot
One number from this literature belongs in every budget conversation: IDC expects Global 1,000 enterprises to underestimate their AI infrastructure costs by 30% through 2027. Benchmarks are a contributing cause. They rank capability and are silent on the token volume required to reach it, and token volume — driven by prompt size, retrieved context, agent loops and the evaluations themselves — is what actually generates the invoice.
Which is why our own build sheets carry a cost per run before they carry a model name. The detail of that is in what an AI operating system costs to run.
Dealing with this in your own group?
We answer scoping questions before there's a contract in sight — including the ones about cost and data handling.